Electronic capacitors must be known for eliminating the voltage characteristics of the power line ripple design
Author: Murata Manufacturing Components Business Division Zakipedia
The variation in the actual electrostatic capacitance of a capacitor when exposed to direct current (DC) or alternating current (AC) voltage is known as the voltage characteristic. A smaller change in capacitance indicates better performance, while a larger change suggests worse voltage characteristics. When capacitors are used in electronic devices for applications like filtering power supply ripples, it's essential to consider these voltage characteristics during design.
DC Bias CharacteristicsDC bias characteristics refer to the phenomenon where the actual electrostatic capacitance of a capacitor decreases when a DC voltage is applied. This behavior is commonly observed in high dielectric constant multilayer ceramic capacitors (MLCCs) using barium titanate-based ferroelectrics, conductive polymer aluminum electrolytic capacitors, conductive polymer tantalum electrolytic capacitors, film capacitors, titanium oxide capacitors, and MLCCs with temperature compensation using calcium zirconate-based paraelectric materials. However, this effect is minimal in C0G-type capacitors (see Figure 1).
For example, when a 1.8V DC voltage is applied to a high dielectric constant MLCC rated at 6.3V with a capacitance of 100 µF, the actual capacitance can decrease significantly. In an X5R-rated capacitor, the capacitance may drop by about 10%, resulting in an effective value of 90 µF. For a Y5V-rated capacitor, the reduction could be as high as 40%, bringing the capacitance down to 60 µF.

Figure 1: Capacitance change rate of various capacitors - DC bias characteristics (example)
When a DC voltage is applied to a barium titanate-based ferroelectric material, the electric displacement (D) initially increases linearly with the electric field (E). As the electric field increases, spontaneous polarization aligns with the field direction, leading to a large dielectric constant and increased capacitance. However, once polarization reaches saturation, the dielectric constant decreases, causing the capacitance to drop (refer to Figure 2).
Therefore, when selecting MLCCs, it’s important not to rely solely on the values listed in the datasheet. Instead, apply the expected DC voltage to the circuit, measure the actual capacitance, and adjust accordingly. The lower the DC voltage, the less impact the bias effect has. With modern semiconductor chips operating at voltages above 1V, such as FPGAs and ASICs, the DC bias effect becomes less significant, and MLCCs perform well in these applications.
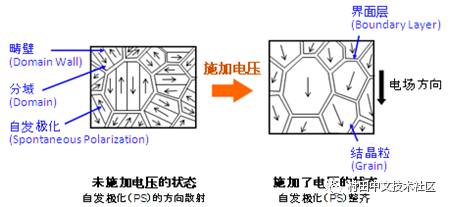
Figure 2: State when a voltage is applied to a ferroelectric ceramic
AC Voltage CharacteristicsAC voltage characteristics describe how the actual electrostatic capacitance changes (either increases or decreases) when an AC voltage is applied. Similar to DC bias effects, this phenomenon is unique to certain types of capacitors, including high dielectric constant MLCCs, conductive polymer aluminum electrolytic capacitors, conductive polymer tantalum electrolytic capacitors, film capacitors, titanium oxide capacitors, and paraelectric MLCCs. However, this effect is negligible in C0G-type capacitors (see Figure 3).
For instance, if a 0.2 Vrms AC voltage at 120 Hz is applied to a 6.3V, 22 µF high dielectric constant MLCC, the capacitance may drop by around 10% for an X5R-type capacitor, reducing it to 20 µF. In a Y5V-type capacitor, the drop could be as much as 20%, resulting in an effective capacitance of 18 µF.

Figure 3: Capacitance change rate of various capacitors - AC voltage characteristics (example)
Ferroelectric ceramics contain domains with randomly oriented spontaneous polarization (Ps). Under an external electric field, these domains align, leading to polarization saturation. Even after the field is removed, some polarization remains, creating residual polarization. To reverse this, an opposite electric field must be applied, which causes polarization inversion. This hysteresis behavior is represented by the DE hysteresis curve shown in Figure 4.
At high AC voltages, the current through the capacitor can cause waveform distortion, making it unsuitable for linear material definitions. However, the relative dielectric constant (εr) calculated from the measured capacitance represents the average slope of the hysteresis curve (dashed line in Figure 4).
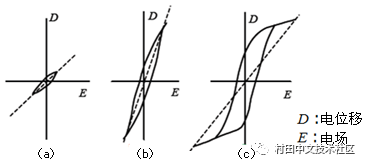
Figure 4: DE hysteresis curve of ferroelectrics
*1: Linear materials exhibit a proportional relationship between stress and strain, where the stress σ is directly proportional to the deformation ε.
Test Chamber,Climatic Test Chamber,Humidity Test Chamber,Temperature Humidity Test Chamber
Wuxi Juxingyao Trading Co., Ltd , https://www.juxingyao.com