Spss clustering analysis tree
Cluster analysis was conducted on each city in Henan Province by means of principal component scores. When performing cluster analysis, the more indicators, the less commonality between samples is displayed. Too many indicators will make the calculated distance between samples larger, which is not conducive to the synthesis and clustering of similarity between samples. The progress of the analysis often fails to achieve the desired classification effect. The SPSS software can draw a complete cluster analysis pedigree map without knowing the final number of categories. Therefore, the cluster analysis of 18 cities in Henan Province is carried out using SPSS software.
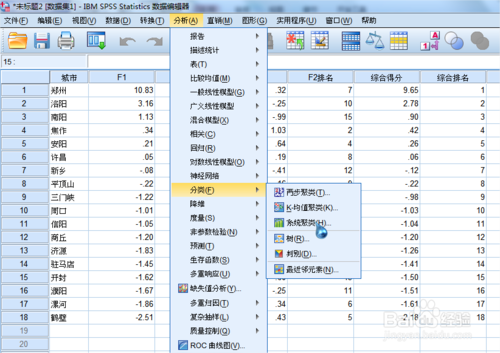
Open the data in spss, select Analysis → Classification → System Clustering:
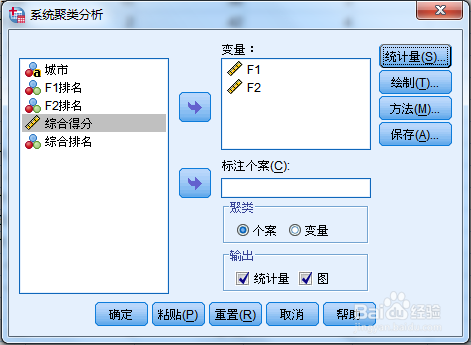
Variables select f1, f2 scores, cluster selection cases, tick output statistics and plots;
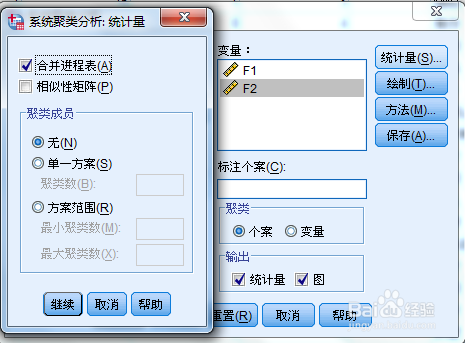
Click to set the statistics, the default selection can be
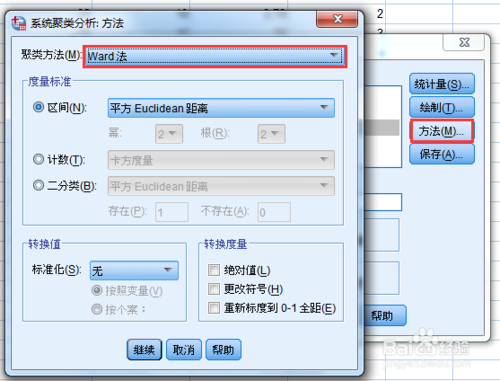
Click to select the classification method, here the dispersion square sum method is selected;
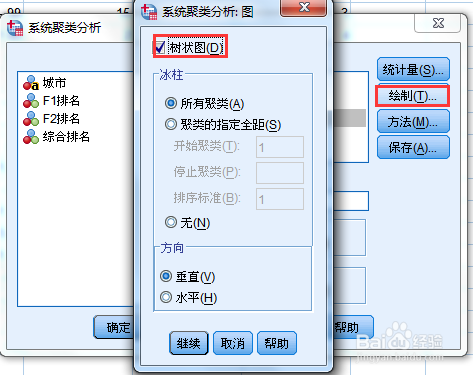
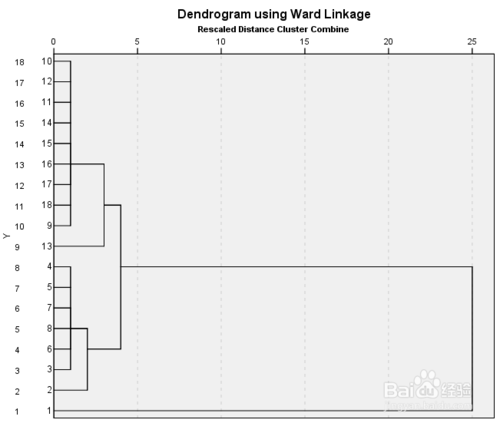
Click on Draw and check the tree view. This is the basis for our input to view the pedigree:
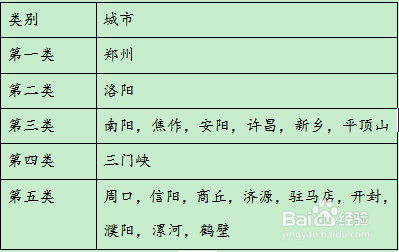
Determine the pedigree map, analyze the clustering results, and use different classification methods to obtain a pedigree map for comprehensive analysis;
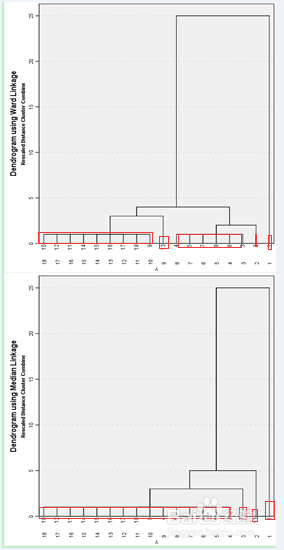
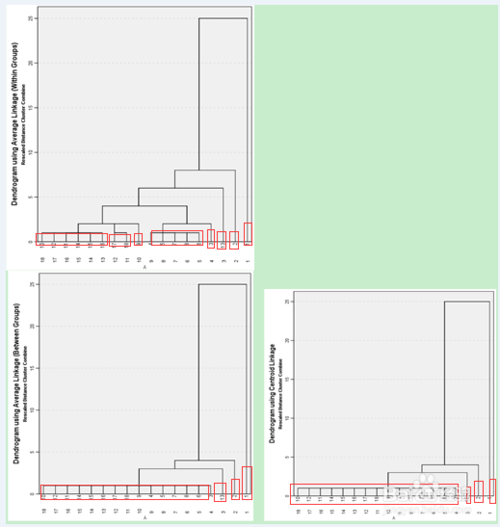
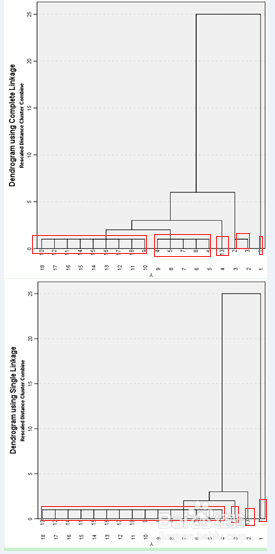
Due to the large number of methods, the selection is most commonly compared with the actual method of squared summation. Only the results of grouping are given, that is, the method of cluster analysis. The analysis of each group is not repeated.
First, the data in Excel, the first line should be the label. For example, the first column is the strain, the third column of the second column is “twoâ€, and the “three†is OK, but it must be there. Otherwise, when the spss reads the data, the first row of data will be treated as a label.
Second, spss open data, select open, file select all file, Excel data can be opened. (Note that if some items are the default values, you must make up the zeros, otherwise there will be missing values ​​when the output is later, that is, the secondary samples will not be processed and will be directly excluded by the computer)
Third, choose the font (very important, directly lead to the beauty of the output image later, many people have fallen in this step, I also, later with word, photoshop processing, but also make do, but not very ideal), in the editing options Edit Select options, enter the viewer, come out of the dialog box, there are two font options, select Tahoma, below (Text output font), choose Courier New. The font size is 10th.
Fourth, analysis, click analyze - Classify - Hierarchical cluster analysis - data import variables, header (label) items imported label case by; click statistics, Ag and Pr are selected, the following Range of solutions (cluster number) selected , generally choose 3-10, Continue. Select the Method item, Standardize select Z scores, Continue, click Plots to select dendrogram, check the Range of solutions and statistics, click ok to generate various charts, including the tree.
Fifth, you can choose the output or screenshot according to your needs. If you output, you can click on the file, Export, you can choose the output format, such as word, ppt and other formats. . The screenshots can generally be divided into three sections, which are stitched together with photoshop software.
(The above steps are based on my own analysis needs. If other analysis methods are needed, the corresponding options can be changed for analysis)
With the advancement of technology, LED technology has been applied to projectors. There are many good domestic LED projector manufacturers in the market. For example, Shenzhen Resources has perfectly combined this technology with DLP technology to make it portable and compact. Because of its low power consumption and heat generation, it is more widely used in life and in personal business. The same goes for LED hotel projectors.
portable led projector,led home theater projector,led holiday projector,led room light projector,led 4k projectors
Shenzhen Happybate Trading Co.,LTD , https://www.happybateprojector.com