How to perform impedance matching with Smith chart
The Smith chart (also known as the Smith chart) is a computational graph that plots a normalized input impedance (or admittance) equivalent on a plane of reflection. It is a diagram for electrical and electronic engineering, mainly used for impedance matching of transmission lines. The diagram consists of three circular systems used to solve the problem in the transmission line and some waveguide problems to avoid cumbersome operations. The impedance of a transmission line changes with its length. To design a matching line, you need to go through a lot of complicated calculation procedures. The Smith chart is characterized by omitting some calculations. program.

Impedance matching The internal resistance of the signal source is equal to the characteristic impedance of the connected transmission line and the phase is the same, or the characteristic impedance of the transmission line is equal to the magnitude of the connected load impedance and the phase is the same, respectively called the input or output of the transmission line. Impedance matching state, referred to as impedance matching. Otherwise, it is called impedance mismatch. Sometimes it's called a match or a mismatch.
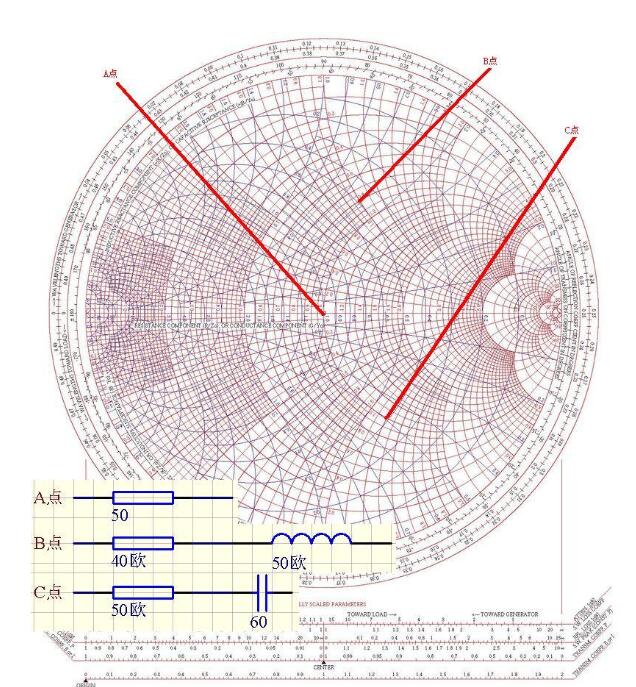
How to perform impedance matching with Smith chartThe Smith chart red represents the impedance circle, and the blue represents the admittance circle! Take the red line as an example!
The middle horizontal line of the circle is a pure impedance line. If it falls a little on this line, it means pure resistance!
For example, a 100 ohm resistor is placed in the middle of the line with a red mark of 2.0; a 15 ohm resistor falls at the point of the red mark 0.3 in the middle!
Above the horizontal line is the inductive line, below is the capacitive line; the point above the line, represented by the circuit, is a resistor in series with an inductor, falling to the point below the line, is a resistor in series with a capacitor.
The circle on the graph indicates the equal impedance line. The impedances on the points on the circle are equal. The upward arc indicates the equivalent inductance line, and the downward arc indicates the equal resistance line!
It can be seen that the sense is tolerance, the high is low and then the blue line.
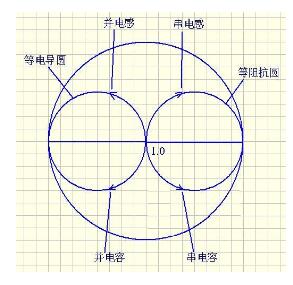
Because admittance is the reciprocal of impedance, many concepts are similar.
In the middle is the electric wire. The circle on the figure indicates the equal conductance circle, the upward is the isoelectric nanowire, and the downward is the equal reactance line! The basic principles for impedance matching calculations using this graph are:
It is a sense of filling, it is necessary to add a sense, it is a high resistance to find a way to go low, it is a low resistance to find ways to raise. At any position, you must move closer to 50 ohms (midpoint).
When matching is performed, the conversion is performed on the equal impedance circle and the equal conductance circle. The picture below shows the trend of change!
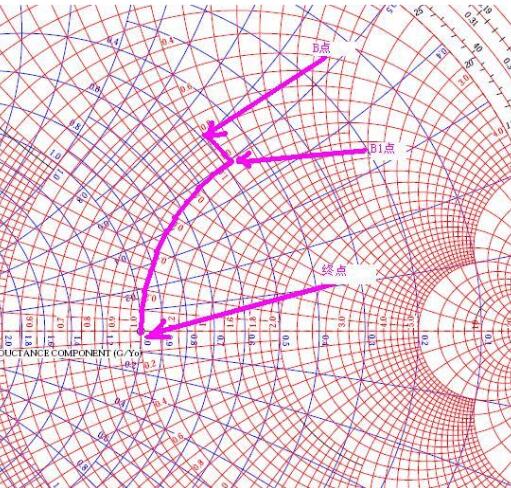
Take the point B on the graph as an example, how to perform impedance matching! !
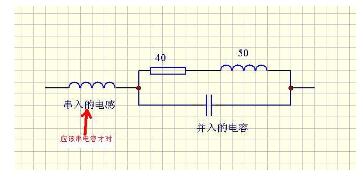
The position of point B is 40+50j. First, follow the equal conductance circle, move to point B1, and then follow the equal impedance circle and run to the end point (50 ohms). According to the motion rule of the attached, the circuit first has a capacitance and then a series of capacitors. This completes the impedance matching. The matching method is finished, and the specific value can be calculated by RFSIM99! !
Let me say, the relationship between the S parameter and the SMITCH chart! !
High-frequency triodes, especially those on the GHz, generally list a bunch of S-parameters. The following takes the S11 parameter at C3355 400MHz as an example to illustrate the relationship between the S parameter and the circle chart. Frequency|S11| Phase 400M 0.054 -77.0
According to the definition of the S parameter, the reflection coefficient of S11 is 0.054, that is, the input power is 1, and the reflected power is about 0.003. Since the SMITCH map is the polar coordinate of the reflection coefficient, it can be expressed by a formula.
r=0.054 (cos(-77/360)+j*sin(-77/360)). r is the impedance point on the chart. According to Z/Z0=(1+r)/(1-r) To understand this formula, you have to turn over the transmission line theory!
Z: required impedance, Z0: normalized impedance, here 50
From the above formula, you can infer Z, and you can find the corresponding point according to the coordinates.
Actually, you don't need such cumbersome calculations, you need to perform impedance matching, and directly input the S parameters with RFSim99, you can automatically calculate the matching network!
Not as difficult as imaginedIn fact, it is equivalent to understanding the power frequency AC to understand this thing. Mathematical understanding of complex arithmetic is enough. The purpose of the smith chart is to simplify the understanding of the theory.
As for the welfare leaf transformation and the Lass transformation, you should not pursue a specific mathematical abstraction model. If you can visualize it, it is enough. How to visualize it: Welfare leaf transformation is a spectrum analyzer. The principle of spectrum analyzer is to multiply the local oscillator signal and the measured signal, that is, mix, let the high frequency component be filtered out, and obtain a DC signal. The local oscillator is swept frequency change, then the horizontal axis is used as the frequency value of the sweep frequency, and the corresponding DC voltage of each frequency point is taken as the value of the vertical axis. Drawing a graph is the image of the spectrum analyzer. The Laplace transform is a mathematical extension of the welfare leaf transform. Why expand? Because some theoretical signals are infinite, so that two infinite signals can't be compared. What should we do? Multiply these two infinite signals by a fixed infinitesimal, and then we can compare the heights. The las transform is the infinitesimal factor that multiplies the measured signal by (1/e)^x, so that all theoretical signal functions can be transformed into a welfare leaf.
In fact, our receiver is a single-frequency point of the welfare leaf transformation.
If we follow the understanding of the source, we must rise to the philosophical thinking, and we must discuss the methodology of thinking. To put it simply, we humans need to understand the external things that our existing senses feel, and want to express what they know, often dissolving the unknown into known ones, using known ones. The combination is unknown, this is the analytical method. For any material motion, whether mechanical or electrical, we now use two basic motions to resolve, namely linear motion and circular motion. The linear motion corresponds to the time domain analysis method, and the circular motion corresponds to the frequency domain analysis method. For our high-frequency signals, the oscilloscope, Time Domain Reflectometry (TDR) is a time domain analysis method, a frequency sweeper, a spectrum analyzer, and a vector analyzer (VNA) are frequency domain analysis methods. If the radius of the circular motion used for parsing is infinite, then the circle is also a straight line, so time domain analysis and frequency domain analysis can be converted to each other, that is, the analysis results of VNA and TDR can be converted to each other. Regardless of the purpose of the analysis, it is to understand the unknown, but the means of analysis are different.
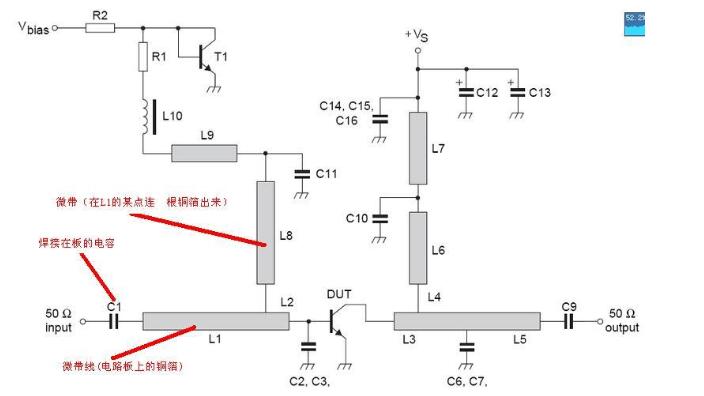
The Smith chart is a simplified method of frequency domain analysis, that is, we ignore the time characteristic of the device or signal, and replace it with the sub-value and phase of the initial motion of the device or signal, but any one value corresponds to Is a fixed frequency point. How to look at the picture. R2, R1, T1 have nothing to do with impedance, draw as usual!
In fact, on the Smith chart: the center of the circle corresponds to the reflection coefficient of 0; the outermost circle corresponds to the reflection coefficient of the mode of 1, the point on the circle corresponds to pure reactance, open circuit, open circuit; and if it is a concentric smaller than the outer circle Circle, the modulus of the reflection coefficient of each point on this circle is also equal
Shenzhen ChengRong Technology Co.,Ltd. , https://www.laptopstandsupplier.com